Huge Chinese Demand to Drive Uranium Export Boom
http://seekingalpha.com/article/238779-huge-chinese-demand-to-drive-uranium-export-boom
 China,
the world's second largest economy, is bracing itself for a huge import
of uranium in order to fulfill a part of its ever increasing energy
requirements as the country plans to add to its current capacity
of 11Gigawatts (at the end of last year) to reach a target of 70
Gigawatts of nuclear capacity by the year 2020. Although
officials with China's leading nuclear companies have expressed
confidence that the country's domestic stocks of uranium are good enough
to fuel its burgeoning fleet of reactors for decades to come,
independent analysts and nuclear experts feel that China would
definitely need to import uranium and a good chunk at that in order to
satisfy the country's ever growing energy needs.
China,
the world's second largest economy, is bracing itself for a huge import
of uranium in order to fulfill a part of its ever increasing energy
requirements as the country plans to add to its current capacity
of 11Gigawatts (at the end of last year) to reach a target of 70
Gigawatts of nuclear capacity by the year 2020. Although
officials with China's leading nuclear companies have expressed
confidence that the country's domestic stocks of uranium are good enough
to fuel its burgeoning fleet of reactors for decades to come,
independent analysts and nuclear experts feel that China would
definitely need to import uranium and a good chunk at that in order to
satisfy the country's ever growing energy needs.Meanwhile, a recent Thomson Reuters report quoted Cao Shudong, director of planning and development at China National Nuclear Corp (CNNC), as admitting that uranium exploration activity within China fell into a lull two decades ago, but drilling had since been stepped up and CNNC had found new mines in the far northwestern regions of Xinjiang and Inner Mongolia. However, some experts disagreed with the rosy assessment of domestic uranium supplies. "China's own domestic uranium resources are, to be frank, not fantastic," said Steve Kidd, director of strategy and development at the World Nuclear Association.
An interesting case in point to the fact that China's domestic needs might not be enough to power the Asian giant is that despite CNNC's confidence in domestic supplies, it has already established China Uranium Corp, a subsidiary specializing in procuring overseas uranium supplies. CNNC is not an isolated Uranium import story as its rival China Guangdong Nuclear Power Corp (CGNPC) has also launched mining projects in Kazakhstan and Uzbekistan. On Wednesday, the company signed an agreement with Canada's CAMECO Corp (CCJ), one of the world's leading uranium producers, to supply 20 million lb of uranium through to 2025.
Uranium Production: Only a handful of mines in Canada and Australia produce uranium as their primary product, although some is also recovered as a by-product of mining other metals, usually gold. Canada currently leads world production, with 25% of the world's output, followed by Australia. Kazakhstan is currently the world's third-biggest uranium miner. The three countries currently account for more than half of global uranium production. Other uranium mining nations include the United States, the Russian Federation, Portugal, Namibia and Niger.
Uranium Supply Vs. Demand: On the supply side, uranium production has been growing at a snail's pace; the major players have started locking up long term supply, and Russia and the U.S. have slowed down their refined uranium sales programs. Annual output of 47,000 tons only meets 58% of demand. The world's 437 nuclear power reactors use about 67,000 metric tons of uranium each year. Uranium mines produced only 42,000 metric tons of uranium in 2005, with the rest of global demand being met from utility stockpiles or from decommissioned nuclear weapons. In fact, worldwide uranium demand already exceeds supply by 139%, and it could take a decade or more before mines are able to crank up production.
Rising Demand: Meanwhile, demand for nuclear fuels is growing. 30 new nuclear power stations are under construction, with several dozen more in the planning stages. China alone, hungry for energy resources of all kinds to fuel its phenomenal economic expansion, intends to bring on line 27 new reactors over the next 15 years. India plans 31 additional reactors, Russia 25.
The world has about 4.7 million metric tons of identified uranium resources, according to International Atomic Energy Agency. In addition, there are another 10 million metric tons of more speculative resources and 22 million metric tons of unconventional resources. This entire total is 600 years of supply.
Uranium Related Exchange Traded Funds:
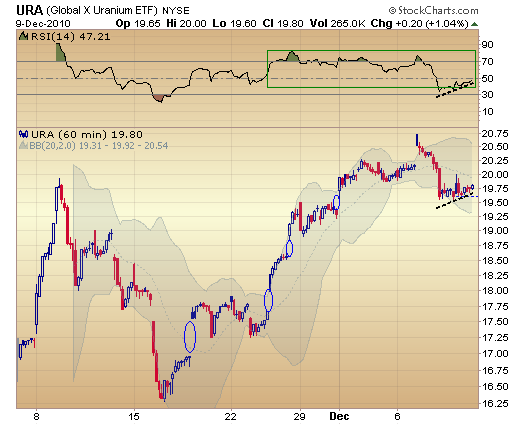
For now, there is no dedicated Fund or ETF for Uranium minerals or metals in the United States markets. A few of these companies directly dealing in Uranium form part of the few Nuclear industry related ETFs. There are Uranium futures at CBOT/Chicago Mercantile Exchange, which are expected to grow once the industry gets more active. See below about this futures market information for interested futures or futures options traders.
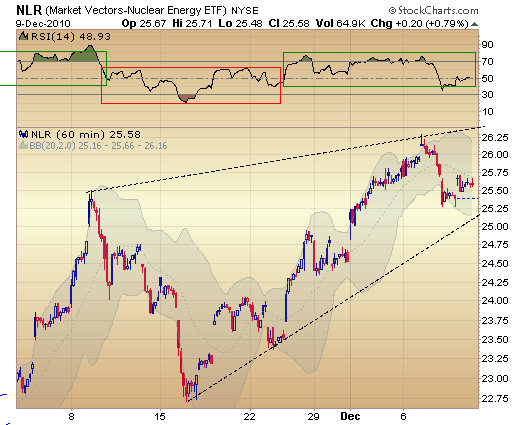
Market Vectors Nuclear Energy (NLR): The Index provides exposure to publicly traded companies worldwide that are engaged in various aspects of the nuclear energy business.
NLR Top Ten Holdings:
1. Electricité de France (EDF): 8.13%
2. Exelon Corporation (EXC): 7.72%
3. Constellation Energy Group, Inc. (CEG): 7.69%
4. Cameco Corporation (CCJ): 6.99%
5. Energy Resources of Australia Limited (ERA): 6.84%
6. Fronteer Gold: 5.76%
7. USEC Inc. (USU): 5.22%
8. Denison Mines Corporation (DNN): 5.13%
9. Paladin Energy Ltd (PDN): 4.82%
10. Mitsubishi Heavy Industries, Ltd. (7011): 4.69%
Expense Ratio: 0.61%
Barclays iShares Global Nuclear Energy (NUCL): The index measures the performance of companies in nuclear energy related businesses.
NUCL Top Ten Holdings:
1. Amec Plc (AMEC): 7.61%
2. Cameco Corporation (CCJ): 7.31%
3. McDermott International (MDR): 7.25%
4. JGC Corp. (1963): 6.74%
5. E.ON Aktiengesellschaft (EOAN): 6.68%
6. Tokyo Electron Ltd. (8035): 6.35%
7. Kansai Elec Pwr (9503): 5.69%
8. Iberdrola, S.A. (IBE): 5.68%
9. Shaw Group (SHAW): 5.63%
10. NextEra Energy Inc (NEE): 5.08%
Expense Ratio: 0.48%
PowerShares Global Nuclear Energy (PKN): The Index is designed to track the overall performance of globally traded companies which are engaged in the nuclear energy industry with representation across reactors, utilities, construction, technology, equipment, service providers and fuels.
PKN Top Ten Holdings:
1. Areva (CEI): 7.41%
2. Toshiba Corporation (TOSBF): 5.75%
3. Exelon Corporation (EXC): 4.84%
4. Thermo Fisher Scientific, Inc. (TMO): 3.32%
5. Equinox Minerals Ltd (EQN): 3.19%
6. Emerson Electric Co. (EMR): 3.14%
7. Paladin Energy Ltd (PDN): 3.12%
8. Hitachi, Ltd. (6501): 3.11%
9. Parker Hannifin Corporation (PH): 3.03%
10. Cameco (CCJ): 2.83%
Expense Ratio: 0.75%
Uranium Outlook: Global population growth, in combination with industrial development, will lead to a near doubling of electricity consumption by 2030. Nuclear energy is on the policy agendas of many countries, with projections for new building projects similar to, or exceeding those of the early years of nuclear power. The Uxc estimates that demand will outstrip all production (secondary and new production included) in 2014, but if the high end of demand is reached, demand will continue to outpace production at an increasing pace through 2020.
Increased awareness of the effects and dangers of global climate change has led decision makers, media and the public to become critical of the use of fossil fuels with the focus on reduction and replacement by low-emission sources of energy, such as nuclear power, a readily available large scale alternative to fossil fuels for production of reliable and continuous supply of electricity.
There are currently 439 nuclear units operating in 30 countries and they supply about 15 percent of the world’s electricity. Over the next 10 years, 108 new reactors are anticipated with the majority of the growth in Asia. Over the same time period, 19 reactors are expected to be shut down, resulting in a net increase of 89 reactors from current levels. Indian reactor demand for uranium, estimated at about 3 million pounds last year, will rise to as much as 10 million pounds in 15 years. Some analysts are forecasting China will increase nuclear power capacity by 9 times current values, targeting 80 GW by 2020.
Disclosure: No positions


No comments:
Post a Comment