The Secret Of Warren Buffett's Alpha
Disclosure: I have no positions in any stocks mentioned, and no plans to initiate any positions within the next 72 hours.
A friend on the trading floor at TD Securities in Toronto sent me a research paper titled Buffett's Alpha last week. I included it in my weekly McNulty Capital Management Newsletter (here). It is an extremely informative research paper examining the returns of Buffett and Berkshire Hathaway (BRK.A), (BRK.B)
and one that would be helpful to the readership at Seeking Alpha, so I
decided to follow up with an article. It was written by Andrea Franzzini
and David Kabiller who are at AQR Capital Management,
which has $44.2 billion in assets under management, and Lasse H.
Pedersen, who is also at AQR Capital Management in addition to New York
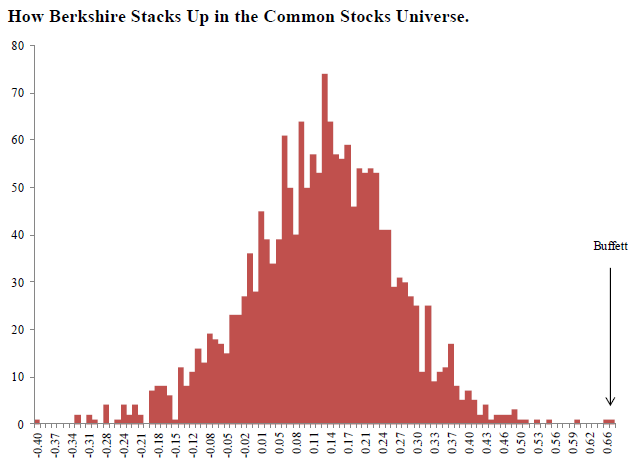
University and Copenhagen Business School.Just how good is Warren Buffett's track record? Using the Information Ratio, which measures the expected return of a manager's active portfolio divided by the amount of idiosyncratic risk (risk that can almost be eliminated with diversification), he has outperformed every single stock and almost every single mutual fund over the past 30-year period on a risk-adjusted basis:
(click to enlarge)
(click to enlarge)

Even when adjusting for risk defined as volatility (a definition many value investors object to), Buffett is in a league of his own.
Coin Flipping and Causal Links
The introduction of this paper makes the excellent point that while everyone seems to have an opinion on Buffett's investing style, there has been little rigorous empirical analysis that explains his performance. The most common debate is between technical investors who write Buffett off as a statistical anomaly told in the tale of the coin flipping contest, and Buffett's counter to that argument told in the tale of the village of expert coin flippers.
The coin flipping thought experiment starts with a stadium full of people flipping coins. Each time, those that flip tails are eliminated, narrowing it down to the "best" coin flipper who consistently land on heads. As the participants are narrowed down, our brain's desire to search out cause and effect leads us to praise and admire the coin flippers that advance as experts who know some secret about coin flipping. These experts would go on to write books, setup websites and give seminars about how you too could be an expert coin flipper. This despite the fact that we know there is no secret to coin flipping, it is a matter of simple probabilities. In every stadium, there will be that improbable anomaly that flips heads 30 times in a row (statistically it works out to about 1 in 1.07 billion will flip 30 heads in a row).
Buffett's counter to this is to take this same stadium and its participants, but the coin flippers who won year after year came from a particular town. Eventually, you would go out to this town and see if you could find a causal link between the coin flipping performance and the habits of the people from this particular town. He then goes on to point out that the disciples of Ben Graham and his school of value investing, some 20 fund managers, have all outperformed the market over a long period of time.
Whichever side of the debate you find more convincing, Buffett has the ultimate trump card that he throws down from time to time; his wallet says he's right.
How Did Buffett Do It?
This paper is quick to praise Buffett and make clear the goal isn't to be a Monday morning quarterback 30 years later. But it does go on to find that almost all of Buffett's return can be attributed to Buffett's use of leverage and betting-against-beta and quality factors. From the abstract:
We estimate that Berkshire's average leverage is about 1.6-to-1 and that it relies on unusually low-cost and stable sources of financing. Berkshire's returns can thus largely be explained by the use of leverage combined with a focus on cheap, safe, quality stocks.It will be news to many investors that Buffett's Sharpe Ratio, which is return per unit of risk, is 0.76. This is much better than S&P 500's Sharpe Ratio of 0.39, but still means that for every 1% of return, there is more than 1% of volatility in his portfolio. With 0.76 being an achievable Sharpe Ratio, Buffett's use of leverage is a key factor in boosting his overall return.
This is quite a revelation given that Buffett often speaks out against the use of leverage. Some choice quotes:
When you combine ignorance and leverage, you get some pretty interesting results.In addition, the leverage used by Buffett is at an extremely low cost. This leverage comes from his insurance businesses, as when his customers pay the premium on an insurance policy to his insurance companies, Buffett borrows this money and invests it in the market. This is what the paper is referring to when it discusses his low-cost and stable sources of leverage.
When leverage works, it magnifies your gains. Your spouse thinks you're clever, and your neighbors get envious. But leverage is addictive. Once having profited from its wonders, very few people retreat to more conservative practices.
You really don't need leverage in this world much. If you're smart, you're going to make a lot of money without borrowing.
Of course, leverage only magnifies gains and losses, it ultimately comes down to stock selection. The paper does an analysis of the empirical data on Buffett's stock selection and finds several key features that won't be a surprise to anyone with the slightest knowledge of Buffett's career:
Safe: low beta and low volatility
Cheap: value stocks with low price-to-book ratios
High quality: profitable, stable and growing companies with high payout ratios
Using the Findings to Enhance Your Stock Selection
This is where the paper gets interesting. Based on the analysis of the empirical data, the reader can follow a systematic way of creating a Buffett-style portfolio. The results are impressive:
(click to enlarge)
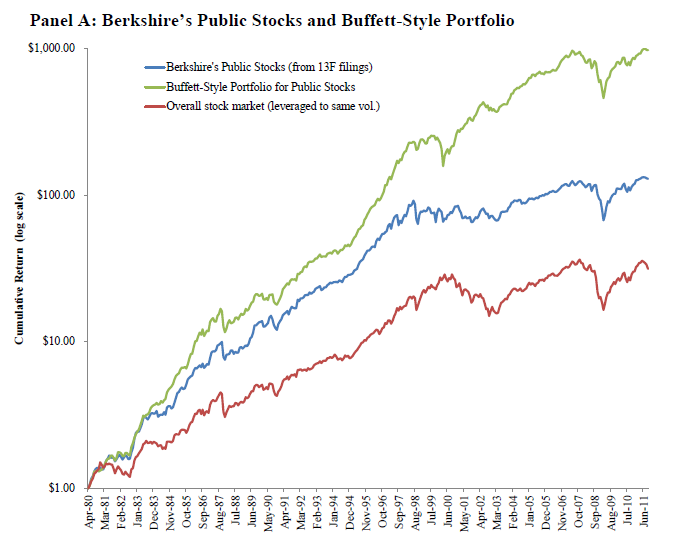
The paper points out, and rightfully so, that the outperformance should be discounted, as hindsight is a significant advantage. The key is the correlation between the two portfolios, indicating a close tracking of Buffett's performance.
Unfortunately, building the systematized Buffett-style portfolio is very complex, involving a number of different formulas from this and other papers as well as an expensive data feed. Having spent the last summer in Hong Kong building similar financial models, it would require at least a full day on Excel and a Bloomberg data feed at $3,000 per month to build properly.
But all is not lost for the retail investor. You can use the findings from this paper as an initial screen in free stock screeners, such as the one provided at FINVIZ.com, to search out Buffett-style investments, at which point you can begin your qualitative research.
Before doing the stock screen, there is another paper, done by two of the same authors that contributes to the Buffet's Alpha paper, titled Betting-Against-Beta that will assist in setting up the stock screen. Beta is the measure as to how much a stock rises with the overall market. For instance, if the S&P 500 goes up 1%, and a stock also goes up 1%, the beta of that stock is 1. If the stock went up 2%, the beta is 2, and if the stock went up 0.5%, the beta is 0.5.
As the name suggests, the Betting-Against-Beta paper finds that betting-against-beta is a profitable strategy.
The findings outlined in the Betting-Against-Beta paper's abstract:
- Since constrained investors ("constrained investors" are investors that are constrained by the amount of leverage they can utilize) bid up high-beta assets, high beta is associated with low alpha.
- A betting-against-beta [BAB] factor, which is long leveraged low-beta assets and short high-beta assets, produces significant positive risk-adjusted returns.
- When funding constraints tighten, the return of the BAB factor is low.
- Increased funding liquidity risk compresses betas toward 1.
- More constrained investors hold riskier assets.
(click to enlarge)

With the findings from the Buffett's Alpha and the Betting-Against-Beta papers, a stock screen can be utilized as an excellent starting point for value investing companies that Buffett himself would potentially hold. As stated in the paper, Buffett buys stocks with the following characteristics:
Safe: low beta and low volatility.
Cheap: low price-to-book ratios.
Profitable: the companies make money.
Growing: positive EPS growth.
High payout ratios: pay out a high percentage of their earnings.
Betting-Against-Beta: as per the paper, relating to low beta and low volatility stocks.
I used these metrics to execute a stock screen in the FINVIZ.com stock screener:
(click to enlarge)
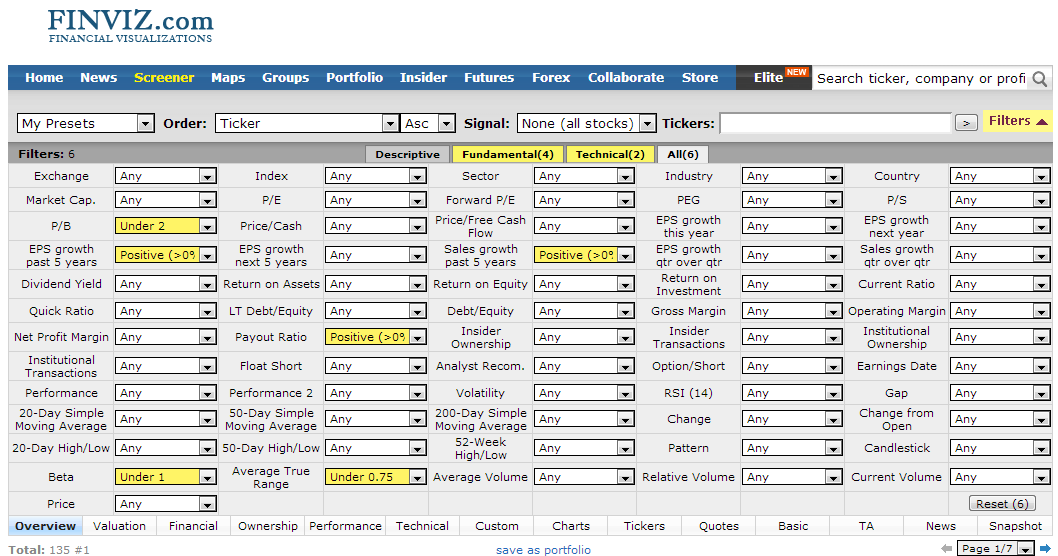
These 135 stocks would be an excellent starting point for a value investor based on the findings of these two research papers.
Conclusion
The best stock screening system in the world will not protect your portfolio from significant drawdowns and negative years. In addition, the most difficult work starts once the stock screen ends, as a value portfolio's profitability ultimately relies on the qualitative research of a business such as its ability to continue to generate cash and the width of its economic moat. This is best outlined by my fellow Seeking Alpha contributor Chuck Carnevale, one of the best value investor writers on the net, in the following chart:
(click to enlarge)
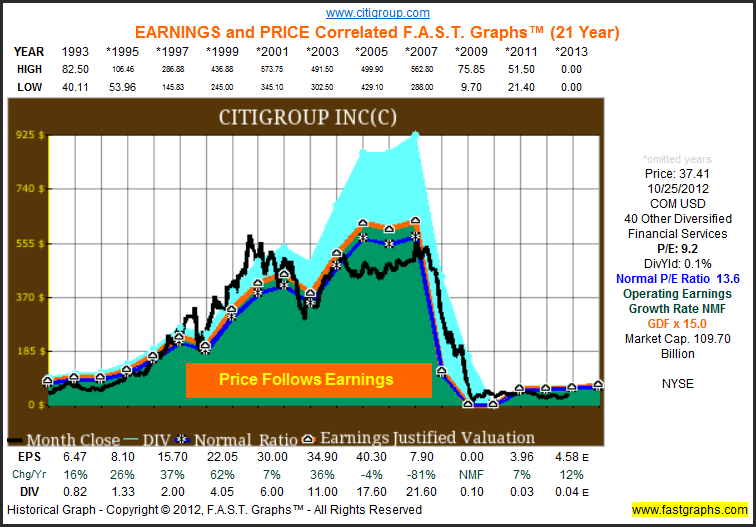
As the chart highlights, prices follow earnings, and it is Buffett's ability to predict earnings that have allowed him to allocate capital better than everyone else over the past 30 years.
The takeaway for retail investors from these two papers is that, rather than seeking out and finding high beta stocks in an attempt to make an extraordinary gain, use an amount of leverage (such as a loan) that you can afford to sustain during significant drawdowns (at least 50% of your portfolio) to buy low beta, quality stocks. If this is done over a number of years, a portfolio built in this manner has been found to outperform on a risk-adjusted basis a stock portfolio made up of high beta stocks and the S&P 500. This approach also created one of the largest fortunes in the world.
- Wall Street Breakfast: Must-Know News by Wall Street Breakfast
- The Real Secret Of Warren Buffett's Performance by Macro Investor
- An Investing Strategy That Is Half Warren Buffett And Half Nassim Taleb by Brendan O'Boyle
No comments:
Post a Comment